
Custom reports
defineReportKind from mlform/view creates a report kind: a config schema, optional payload
validation, and one of two renderers. Register it with a plugin.
Descriptor content
Section titled “Descriptor content”For summaries, tables, and lists, return descriptor nodes; MLForm renders them with the theme:
import { defineMLFormPlugin, defineReportKind } from "mlform/view";import { baseReportConfigSchema } from "mlform/schema";import { z } from "zod";
const payloadSchema = z.object({  level: z.enum(["low", "moderate", "high"]),  score: z.number(),  drivers: z.array(z.string()),});
export const riskSummary = defineReportKind({  kind: "risk-summary",  schema: baseReportConfigSchema.extend({ kind: z.literal("risk-summary") }),  payloadSchema,  render: {    summary: ({ payload }) => {      const { level, score } = payload as z.infer<typeof payloadSchema>;      return { title: "Frost risk", value: score, badge: level, tone: level === "high" ? "danger" : "neutral" };    },    content: ({ payload }) => {      const { score, drivers } = payload as z.infer<typeof payloadSchema>;      return [        { type: "metric", label: "Score", value: score.toFixed(2) },        { type: "list", label: "Main drivers", items: drivers },      ];    },  },});
export const riskPlugin = defineMLFormPlugin({ reports: [riskSummary] });
Node type |
Shape |
|---|---|
text |
{ label?, value, tone? } |
metric |
{ label, value, hint?, tone? } |
kv |
{ label?, entries: [{ label, value }] } or an object |
list |
{ label?, items, ordered? } |
table |
{ label?, columns: string[], rows: object[] or unknown[][] } |
badge |
{ label, tone? } |
notice |
{ title?, body, tone? } |
json |
{ label?, value } |
tone is neutral, info, success, warning, or danger. summary returns
{ title?, description?, value?, badge?, tone? } for the report’s header.
Your own DOM: render.mount
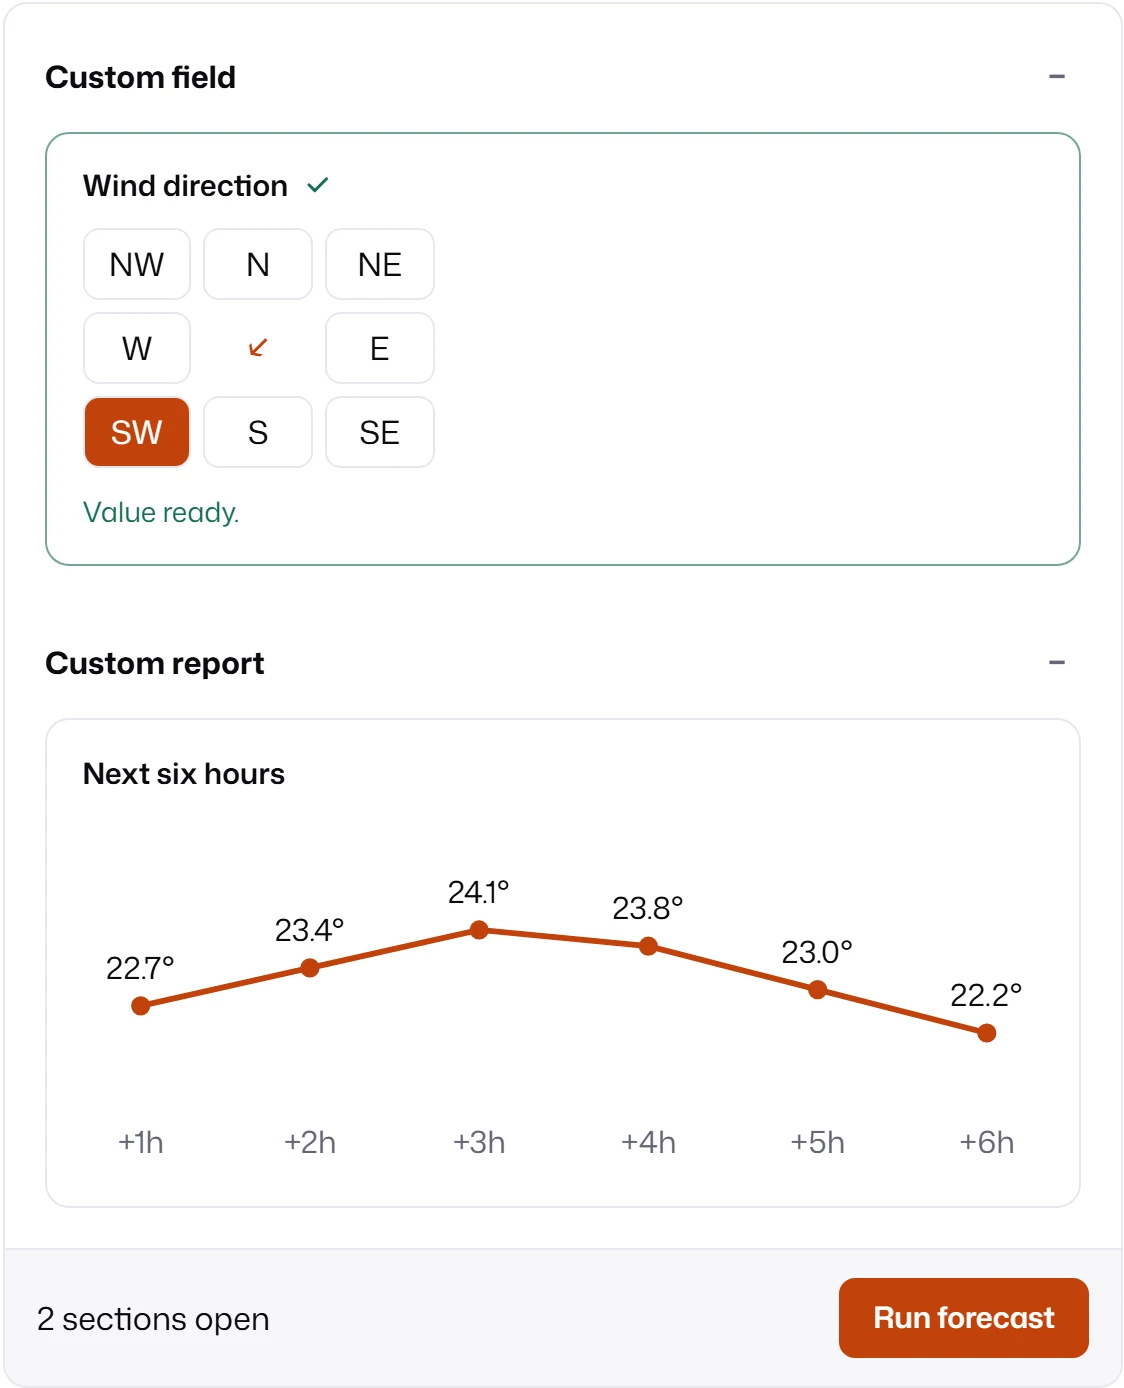
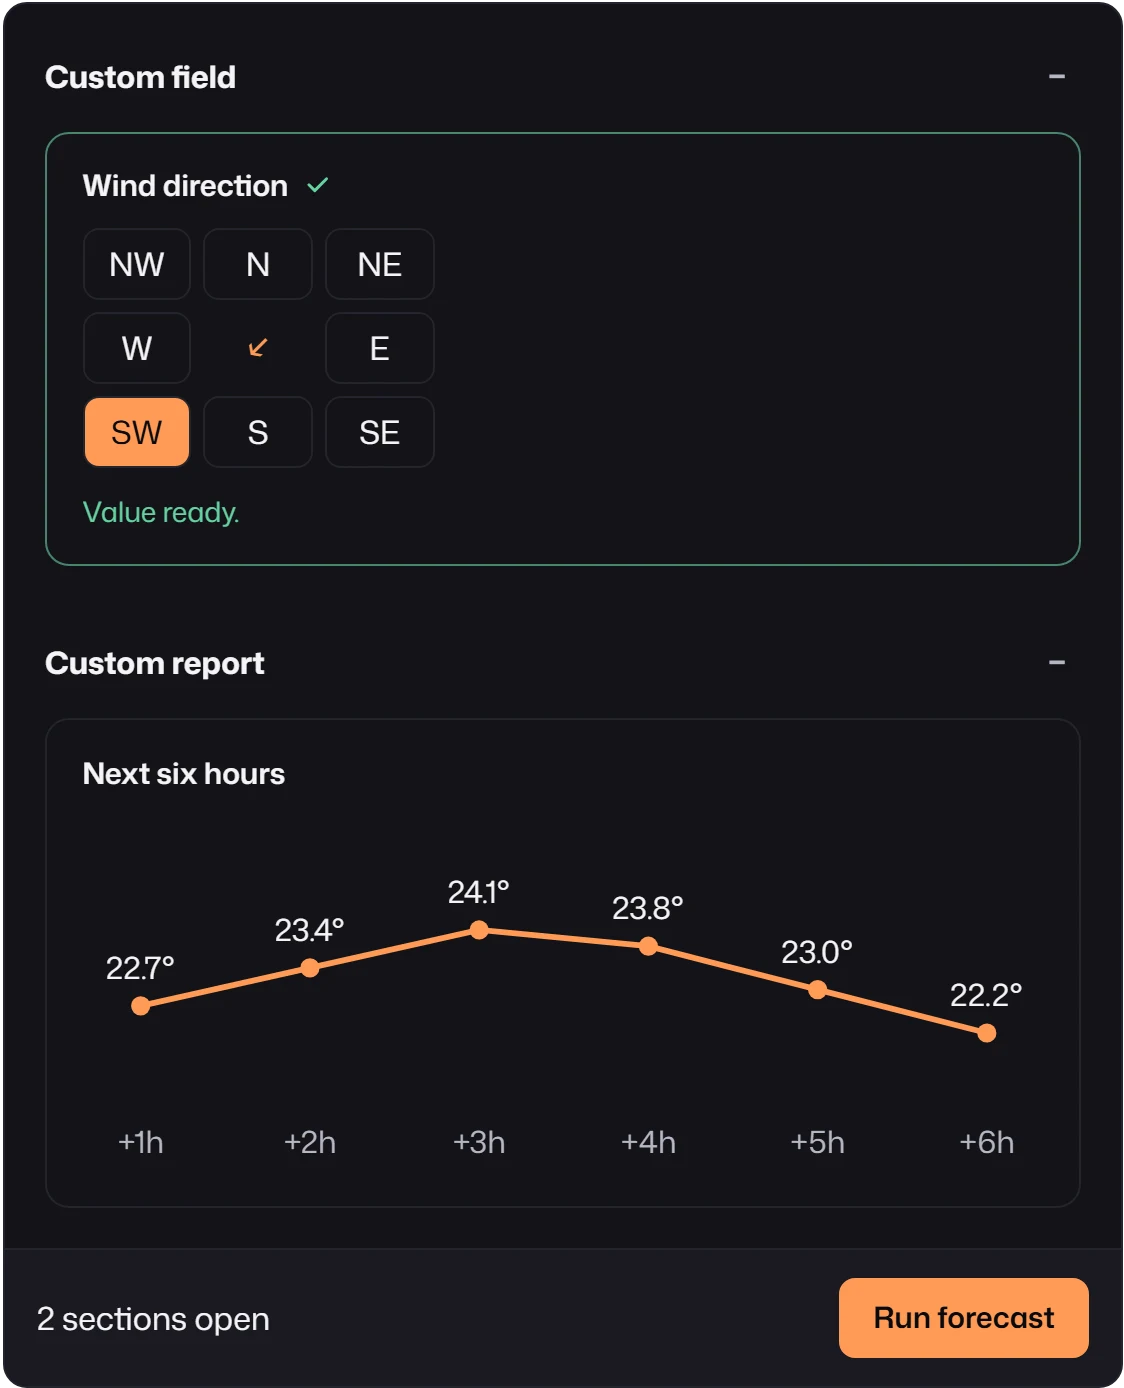
Section titled “Your own DOM: render.mount”For charts and anything else, render.mount receives an element and draws into it. The chart in
the Plugins screenshot is this complete file:
import { defineReportKind } from "mlform/view";import { baseReportConfigSchema } from "mlform/schema";import { z } from "zod";
export const forecastChart = defineReportKind({  kind: "forecast-chart",  schema: baseReportConfigSchema.extend({    kind: z.literal("forecast-chart"),    unit: z.string(),  }),  // Payloads are parsed before mount, so the markup only interpolates numbers.  payloadSchema: z.array(z.number()).min(2),  render: {    mount: ({ element, payload, report }) => {      const values = payload as number[];      const [low, high] = [Math.min(...values) - 1, Math.max(...values) + 1];      const points = values.map((value, hour) => [        30 + (hour * 440) / (values.length - 1),        30 + ((high - value) / (high - low)) * 110,      ]);      const marks = points.map(        ([x, y], hour) => `        <circle cx="${x}" cy="${y}" r="5" fill="var(--mlf-color-accent)" />        <text x="${x}" y="${y - 14}">${values[hour].toFixed(1)}°</text>        <text class="hour" x="${x}" y="174">+${hour + 1}h</text>`,      );      element.innerHTML = `        <svg viewBox="0 0 500 180" role="img"          fill="currentColor" text-anchor="middle">          <style>.hour { fill: var(--mlf-color-text-muted) }</style>          <polyline points="${points.join(" ")}" fill="none"            stroke="var(--mlf-color-accent)" stroke-width="3" />          ${marks.join("")}        </svg>`;      element.firstElementChild?.setAttribute(        "aria-label",        `${report.label}: ${values.join(", ")} ${report.unit}`,      );    },  },});
The mount context contains:
| Property | Meaning |
|---|---|
element |
An empty element inside the report frame. Draw here. |
payload |
The payload, already validated by payloadSchema. |
report, config |
The normalized report config (here report.unit and report.label). |
reportId, state, result |
The report id, its state snapshot, and the submission result. |
signal |
Aborts when the report is re-rendered or removed. Use it for listeners and fetches. |
The lifecycle:
mountruns when the report becomesready, and again when its descriptor changes, for example after the next submission. Before each run MLForm calls the previous cleanup, aborts the previoussignal, and emptieselement.- Return a cleanup function to stop timers, observers, or chart instances.
- If
mountthrows, the report showsReport render failed:and the message. - Skipped, error, and empty states are rendered by the frame;
mountis not called for them. render.contentis ignored whenmountis present.
The element lives in a shadow root: page styles do not reach it, but CSS custom properties do. Use
the --mlf-* tokens, as the chart does with var(--mlf-color-accent), so the drawing follows the
active theme and mode.
Two habits from the example are worth keeping:
- Validate before you interpolate.
payloadSchemaguarantees numbers before they go into markup, soinnerHTMLnever receives backend strings. UsetextContentfor any text from the payload. - Describe the graphic. The SVG has
role="img"and anaria-labelwith the values, so screen readers get the data the chart shows.
Payload rules
Section titled “Payload rules”| Option | Effect |
|---|---|
payloadSchema |
Zod schema the payload must pass. Its parsed output becomes the payload. |
payloadValidationPolicy |
"report-error" (default) puts only this report in error; "fail-submit" fails the submission with ReportPayloadError. |
resolve({ report, result, signal }) |
Builds the payload from the whole submission result instead of the matching envelope. If it throws, only this report fails. |
clonePayload |
Copies payloads that are not plain data. |
fetch |
Loads the payload after submission. See Report fetches. |
Without resolve, the payload is the matching envelope’s payload, routed by backend and
mappedTo like any built-in report. Use resolve only
when the payload combines several outputs; it receives result.reports and result.reportContexts.
Lower level
Section titled “Lower level”defineReportDefinition from mlform/schema, together with your own presenter and a custom
element extending PrimitiveReportElement or PrimitiveAsyncReportElement, gives full control over
the visual contract. Most kinds do not need it: render.mount already hands you the DOM. See
Registries and renderers.