
Series
Use series when a model needs repeated observations, such as readings over time, or numeric
features calculated from them. The user edits a table; you decide whether the model receives the
rows, statistics computed from a column, or both.
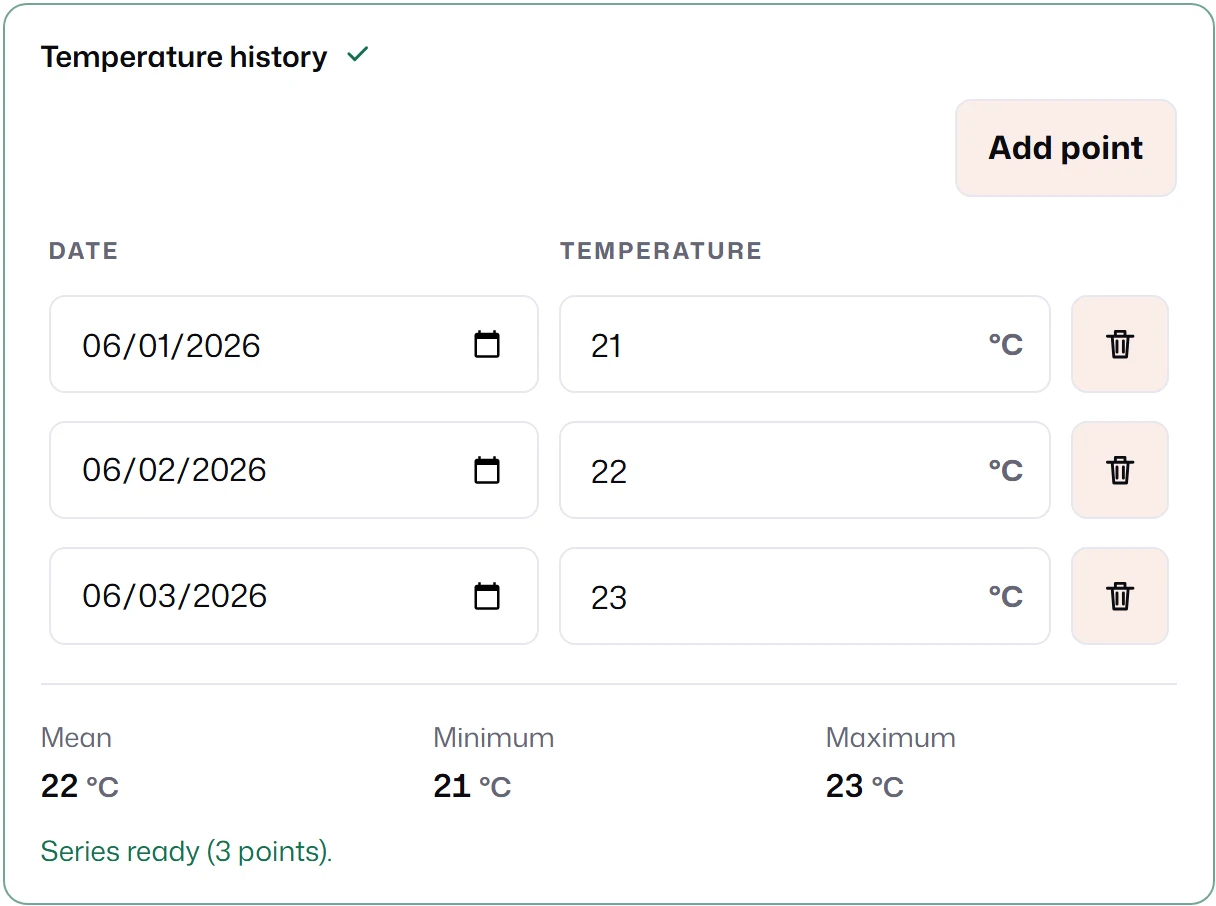
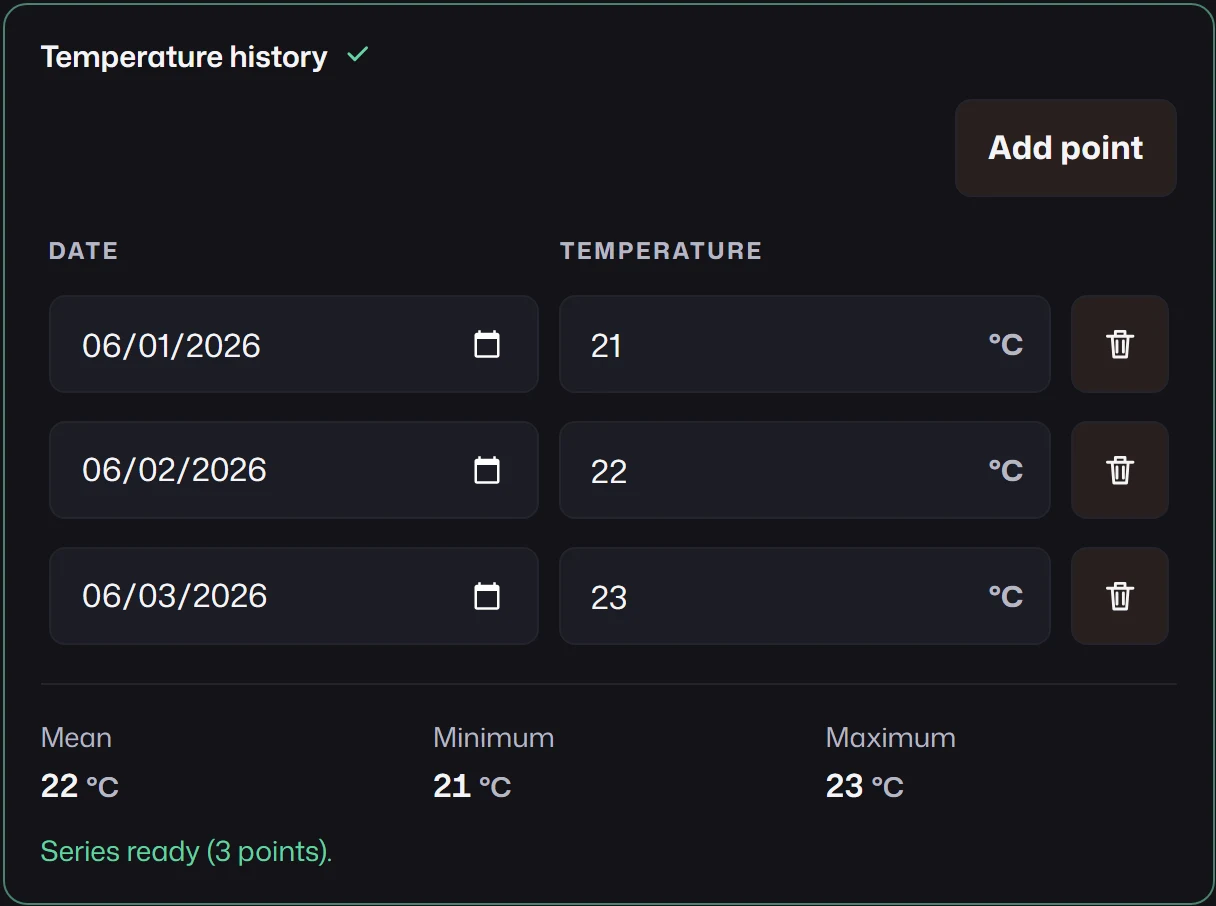
{ id: "readings", kind: "series", label: "Temperature history", required: true, minPoints: 2, showAggregationSummary: true, columns: [ { id: "date", kind: "date", label: "Date", required: true }, { id: "value", kind: "number", label: "Temperature", unit: "°C", required: true }, ], defaultValue: [ { date: "2026-06-01", value: 21 }, { date: "2026-06-02", value: 22 }, { date: "2026-06-03", value: 23 }, ], aggregations: [ { label: "Mean", source: "value", operation: "mean", mappedTo: "mean" }, { label: "Minimum", source: "value", operation: "min", mappedTo: "minimum" }, { label: "Maximum", source: "value", operation: "max", mappedTo: "maximum" }, ],}Without a top-level mappedTo, this field sends only the three aggregates:
{ mean: 22, minimum: 21, maximum: 23 }.
Columns
Section titled “Columns”Each row is an object keyed by column ids, such as { date: "2026-06-01", value: 21 }. columns
needs at least one entry, sets the display order, and has no maximum.
- Kinds. A column uses one of the built-in kinds
text,number,date,category, orboolean, with the same options and constraints as the top-level kind: number ranges, date bounds, categoryoptions, text length and pattern. Invalid column configuration fails schema normalization. - Ids. Column ids are unique within the series, start with an ASCII letter or underscore, and
contain only ASCII letters, digits,
_, or-.__proto__,constructor, andprototypeare reserved. A column id names a cell; it is independent of the series’ own id, display key, or backend targets. - Values. Cells are matched by column id, never by position or label. Undeclared keys in a row are ignored, missing cells are normalized by their column’s kind, and malformed rows stay as empty rows that fail validation instead of being dropped.
- Order. MLForm keeps rows in the order given and keeps duplicates. Sort or de-duplicate rows before assigning them if your model requires it.
minPoints and maxPoints bound the number of rows. The editor disables removing rows at the
minimum and adding rows at the maximum. Adding a row focuses its first cell; removing one moves
focus to a nearby row. In narrow containers each row stacks its cells with their column labels.
Serialization
Section titled “Serialization”Set mappedTo on the series to send its rows. Each cell is serialized by its column’s kind, so
dates become full ISO timestamps and numbers stay numbers. With mappedTo: "history":
{ "history": [ { "date": "2026-06-01T00:00:00.000Z", "value": 21 }, { "date": "2026-06-02T00:00:00.000Z", "value": 22 } ]}The rows are also the field’s value in inputs[].value, in displayValues under its
displayKey, and in draft snapshots.
Aggregations
Section titled “Aggregations”Each aggregation reads one numeric column (source), applies an operation, and writes the result
to its own mappedTo. No extra form field is needed for the result. Every aggregation requires
label, source, operation, and mappedTo; mappedTo accepts the same forms as a field’s,
including a per-backend map. An aggregation without a target for the submitting backend is skipped.
| Operation | Result |
|---|---|
min, max |
Smallest, largest observation. |
count, distinct-count |
Number of observations, number of distinct values. |
sum, product |
Sum, product of all observations. |
first, last |
First, last observation in row order, without sorting. |
mean |
Arithmetic mean. |
geometric-mean, harmonic-mean |
Unweighted means; negative values are invalid and any zero gives zero. |
rms |
Square root of the mean of the squares. |
median |
Linear quantile at q = 0.5. |
mode |
Most frequent value; ties go to the smallest value. |
quantile |
Requires q between 0 and 1 and method: "linear". |
range, iqr |
Maximum minus minimum; third minus first quartile (linear). |
variance, stddev |
Requires ddof. |
sem |
Standard error of the mean, stddev / √n; requires ddof. |
cv |
stddev divided by the signed mean, not a percentage; requires ddof. |
mad |
Median absolute deviation from the median, unscaled. |
mean-absolute-deviation |
Mean absolute deviation from the mean. |
skewness |
Fisher–Pearson skewness; requires bias. |
kurtosis |
Fourth standardized moment; requires bias and fisher. |
The statistical conventions follow NumPy and SciPy so features match common training code:
ddof(a non-negative integer) sets the divisorn - ddof:0for population,1for sample statistics. There must be more thanddofobservations. See NumPy variance.- Linear quantiles sort a copy of the values and interpolate at
q * (n - 1), like the NumPy linear method. bias: truedivides central moments byn;bias: falseapplies the sample correction and needs at least three (skewness) or four (kurtosis) observations.fisher: truesubtracts 3 (excess kurtosis). See skew and kurtosis.- Calculations use every observation as entered: no rounding, filtering, unit conversion, or time windows.
aggregations: [ { label: "Readings", source: "value", operation: "count", mappedTo: "n" }, { label: "Sample deviation", source: "value", operation: "stddev", ddof: 1, mappedTo: "sd" }, { label: "First quartile", source: "value", operation: "quantile", q: 0.25, method: "linear", mappedTo: "q1" }, { label: "Sample skewness", source: "value", operation: "skewness", bias: false, mappedTo: "skew" }, { label: "Excess kurtosis", source: "value", operation: "kurtosis", bias: false, fisher: true, mappedTo: "kurt" },]Missing and invalid values
Section titled “Missing and invalid values”- Every populated row needs a finite number in each aggregated column, even if that column is not
required. Missing or invalid cells block submission; MLForm never drops rows or turns gaps into zero. - An optional empty series sends
0forcount,distinct-count, andsum,1forproduct, andnullfor every other operation. UserequiredorminPointswhen the model needs data. - Results that are undefined (for example
cvwith a zero mean, or skewness of a constant series), outside a valid domain, or not finite block submission. Hiding the summary does not disable these checks.
Rows and features together
Section titled “Rows and features together”- Omit the series
mappedToto send only the aggregates; set it to send the rows as well. valuePathcannot be combined withaggregations; give each aggregate amappedToinstead.- Duplicate, overlapping, or unsafe aggregate targets fail schema normalization, like any other submission path.
showAggregationSummary: true adds the live summary shown above. It uses the source column’s unit
where the result has the same dimension, squares it for variance, and omits it for counts,
product, cv, skewness, and kurtosis.
Custom editors
Section titled “Custom editors”The calculations and cell checks are exported from mlform/builtins for headless renderers:
calculateSeriesAggregation(points, aggregation)returns one aggregate for normalized numeric points, keeping their order. It returns the empty-series value above, ornullfor incomplete, undefined, or non-finite input. It does not run range or row-count validation; validate the form before using the result.getSeriesCellErrors(value, config)returns one record per row, keyed by column id, with each cell’s messages, using the same rules as runtime validation.
mapped-category also turns one control into several model values,
but from fixed presets chosen by the user. Use series aggregations when the values are computed
from what the user entered.